In the Savannah area, the interface between Pleistocene sands and the deeper Miocene clay layers can shift dramatically within a single site. Before you stake out a foundation or plan a stormwater infiltration system, you need to know where that conductive clay sits. Electrical resistivity imaging, and specifically vertical electrical sounding, gives us a continuous profile without having to punch a hole every ten feet. It's a go-to method in Chatham County because the high water table — often just 3 to 5 feet below the surface in the coastal plain — creates strong resistivity contrasts that make the data clean and interpretable. We run VES arrays with 4-pin and Wenner-Schlumberger configurations, then invert the apparent resistivity to true resistivity. The result is a layered model that tells you sand thickness, clay depth, and likely groundwater salinity, all critical for Savannah's coastal environment. When a project calls for direct physical sampling, we pair resistivity with test pits to ground-truth the geophysical data.
Resistivity is not about finding water — it's about finding the clay. In Savannah, that distinction saves foundations.
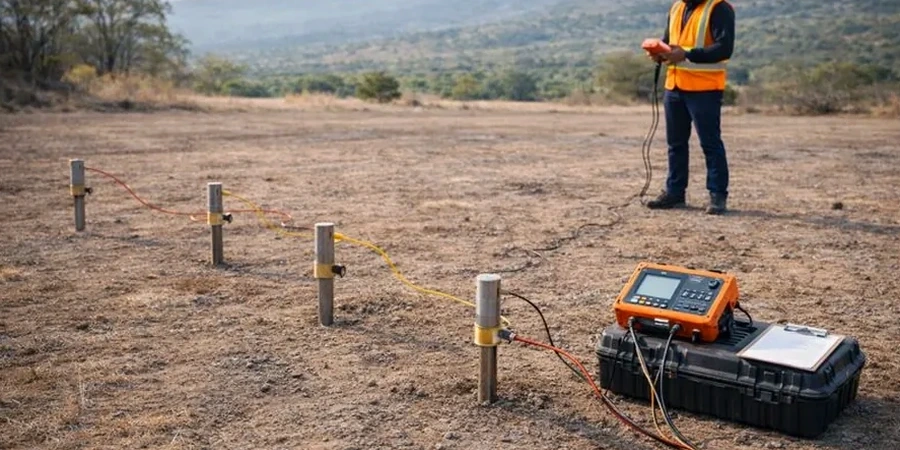
Process and scope
Local ground factors
The geological profile beneath Savannah consists of Quaternary deposits—sands, silts, and clays—resting on the Miocene-aged Hawthorn Group, with the shallow water table typically only a few feet deep. A critical error in this environment is mistaking a zone of low resistivity for a competent clay layer when it is actually a sand saturated with brackish water; such a misjudgment can result in undersized footings or infiltration basins that fail. Although less common than in central Florida, sinkholes do occur in the underlying limestone, particularly in Effingham and Chatham counties, so we actively seek resistivity anomalies that may indicate voids during our surveys. Additionally, the high frequency of lightning strikes in summer forces us to conduct vertical electrical soundings (VES) during morning hours while tracking storm cells in real time to protect both personnel and equipment. Neglecting a proper resistivity survey prior to designing a deep excavation could lead to encountering an unexpected sand channel that sparse borings failed to reveal.
Reference standards
Geophysical methods are accepted under IBC 2021 Section 1803 for geotechnical investigations. Our field methods follow USGS OFR 00-345, the manual for resistivity surveys. Load design inputs rely on ASCE/SEI 7-22 for geophysical site class. The resistivity survey procedure itself conforms to ASTM D6431-18.
Other technical services
1D Vertical Electrical Sounding (VES)
We take point measurements at carefully chosen spots over your property to capture vertical resistivity variations. From these, we build a layered model that outlines the boundaries between sand, clay, and the water table, with our interpretations linked to USGS regional hydrogeologic cross-sections. This approach works well for assessing stormwater infiltration potential and for initial planning of foundation depths.
Resistivity Profiling & Data Integration
Horizontal profiling along survey lines, combined with VES points, to detect lateral changes in soil type and groundwater salinity. We integrate resistivity results with boring logs or CPT data when available, producing fence diagrams that show the subsurface in a way a single boring never can.
Typical parameters
Frequently asked questions
How deep can a VES survey reach in Savannah's coastal plain soils?
For VES soundings conducted in the typical low-resistivity sandy soils of Savannah, we achieve investigation depths ranging from 80 to 100 feet by employing a maximum AB/2 spacing of 150 feet. The depth reached is influenced by the resistivity contrast between strata. For instance, a layer of dry sand above saturated clay produces a robust signal and greater depth, whereas a uniformly moist and saline profile restricts penetration since the highly conductive near-surface discourages deeper current flow.
How much does an electrical resistivity survey cost in Savannah?
In the Savannah metropolitan area, a standard VES resistivity survey for a residential or light commercial property, featuring 3 to 5 sounding points and a comprehensive written report, costs between $640 and $1,100. For bigger endeavors or projects that demand detailed 2D resistivity imaging, pricing depends on the linear footage and the count of sounding points. The quoted price encompasses field mobilization, data collection, inversion modeling, and the final engineering report, complete with interpreted cross-sections.
Can resistivity tell the difference between brackish and fresh groundwater?
That is correct, and it's a key motivation for applying resistivity surveys in the Savannah region. In sandy aquifers, fresh groundwater usually exhibits resistivity exceeding 50 ohm-m, whereas zones with brackish or saltwater intrusion fall under 10 ohm-m, occasionally reaching 1 ohm-m. Through mapping these low-resistivity areas, we can identify the freshwater-saltwater boundary—a critical factor for coastal construction dewatering and ensuring the longevity of deep foundations. Our resistivity models are cross-checked with data from local USGS monitoring wells to verify the interpretations.